
By Abhijit Roy
The COVID19-induced global economic recession has no previous template. Economists are scratching their heads to describe this crisis, determine which alphabet shape the recovery would follow – ‘V’, ‘W’, ‘U’ or L – and ending up with a big ‘?’ mark or an unfathomable alphabet soup.
The situation is also upsetting all previous indexes used to forecast trends. The Lipstick Index has lost all meaning now that all lips are eclipsed by the ubiquitous face mask. This index was coined by Leonard Lauder, chairman of Estée Lauder, who noticed an interesting shift in sales trend following the 9/11 attacks in 2001. He found that against the backdrop of an uncertain future, people still wanted to indulge in shopping to derive some satisfaction from the fact that they could afford something, but they desisted from buying expensive items – and so most of them bought lipsticks. Lauder observed that in the months following the attacks, his company’s lipstick sales doubled; ergo the Lipstick Index was born. Further research demonstrated that historically, surges in lipstick sales occurred during difficult economic times, revealing the Leading Lipstick Indicator to be a relatively reliable metric for determining consumer confidence.
READ: India’s storied middle class may be sliding into poverty
And not just lipsticks – there are several other indices which, though not perfect, are supposed to give some indications about the direction of the economy. But most of them are now thrown into utter confusion in this pandemic.
The Hemline Index, first proposed in 1925 by George Taylor, suggested that skirt hemlines are higher when the economy is performing better, and longer during downturns. Feminists may fume, but economists have developed the idea ever since; not being a hemline watcher myself, I really can’t comment on this one!
The Haircut Index, based on observations by Paul Mitchell, founder of John Paul Dejoria, suggests that customers will visit salons for haircuts every six weeks during good economic times, but every eight weeks when consumer confidence drops. This has certainly gone haywire now as salons and barber shops remain closed and most opt for a cut at home. Having lost my fair share of hair in the last few years, this, too, is not of much relevance to me.
READ: Strong state, attacks on freedom, protectionism will mark post-Covid world
The Dry-Cleaning Index, a favourite theory of former Fed Chairman Alan Greenspan, suggests that when consumer confidence is low, dry cleaning sales figures drop – and resume again when the economy improves. During a lockdown this index is pretty much pointless.
The Men’s Underwear Index, another theory posed by Greenspan, suggested that a decline in men’s underwear sales indicates a poor overall state of the economy, while an upswing in sales predicts an improving economy. I am wondering what’s happening to this index, though it’s prudent not to discuss dirty…err… linens on social media.
But enough with obscure indices that work more based on conjectures rather than cold economic fact. I, for one, am a firm believer of an index based on a strong fundamental economic model with proven experience in describing the economy. To say that almost no such index exists might hurt the self-importance of several leading economic minds of the past century. God forbid we offend the neoclassicals, of course. But truth be told, there genuinely are very few indices (read: none) whose assumptions hold well enough to fit empirical data without too many inherent biases.
READ: Eight factors behind Kerala government’s successful Covid-19 response
But for argument’s sake, let’s just assume that the Consumer Confidence Index (CCI), described and maintained by The Conference Board, a global business research organisation, is a decently accurate indicator for consumer behaviour. In the April 2020 Consumer Confidence Survey conducted by the Reserve Bank of India, the CCI has shown a slight improvement in score – up to 85.6 from 83.7 in January 2020, with a big red arrow pointing upwards right next to it. Historically, red arrows have pointed downwards and green arrows upwards, although an upward pointing red arrow could hardly be considered a wild novelty given the way 2020 has unfurled so far. But what does this big upward red arrow mean exactly?
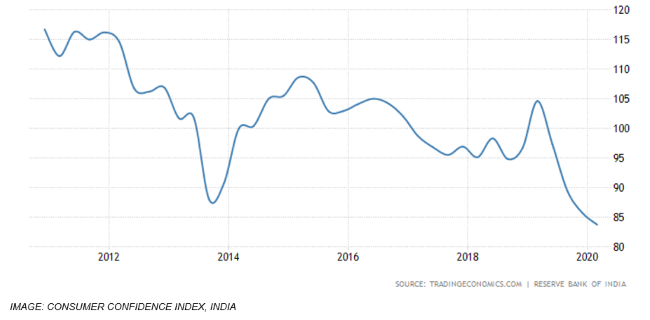
“Negative Sentiments with signs of improvement compared to last round” – reads the legend at the bottom of the table. So does that mean Aggregate Demand in the economy is going up? No, let’s not kid ourselves. It is still quite low, and far adrift from the highs recorded a few years ago when the economy hadn’t yet fallen second to partisan political agendas or demonetization fiascos. Honestly, there’s not much to be confident about either – I’m not even sure I’ll be able to carry out my next 8PM ‘Mann ki Task’ properly.
Major consultancies have already predicted near-zero growth in the coming days, and a drastic fall in demand in most sectors. Despite multiple cushions being offered to the supply-side of the economy along with multiple liquidity injections, economic growth is unlikely to pick up until Demand grows stronger. The consumption problem is going to persist – until of course there comes a time when it won’t. Social distancing will become norm, vaccines will be born, the economy will open up completely and ‘Post-COVID Bonanza Sales’ will be on every billboard from Kashmir to Kanyakumari. But perilous is the road to heavenly kingdom.
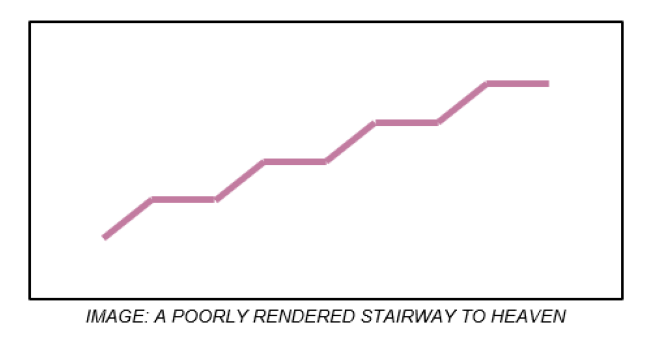
The recovery shape has been proposed to be akin to almost every letter of the English alphabet. Well maybe except for ‘O’ because then we’d just be going around in circles! Economists have even been creative enough to propose a Nike logo-shaped ‘swoosh’ recovery curve. Well, today I’d like to propose Led Zeppelin’s greatest contribution to mankind as the recovery shape. The ‘Stairway to Heaven’ curve will move upwards – gently sloped and slowly rising – with small intermediate periods of flat growth where the economy intermittently tires itself out while having to climb so many steps, and so it pauses, stops to breathe, and then rises again. Such a curve will take its own sweet time, but it can only go up – and take along everyone on its way.
Until then, think of ways to spend your money – to save the economy, of course!
(Abhijit Roy is a technology explainer and storyteller. He spent more than 20 years in the IT industry after starting his career as a journalist.)