
The latest PLFS data put India’s unemployment rate at a 5-year low. On a quarter-on-quarter basis, the jobless rate in urban India fell in October-December quarter of financial year 2023-24 to 6.5% from 6.6% in the previous period, shows the latest Periodic Labour Force Survey data. Economists have raised several critical questions about the veracity of these numbers and pointed out some discrepancies between official statistics and the lived experiences of workers. The government’s PLFS definition deviates from international standards, potentially understating unemployment, says Dr Santosh Mehrotra, visiting professor at the Centre for Development studies, University of Bath, UK. Issues such as low wages, lack of benefits, and job security remain hidden within the data, he tells Policy Circle’s Prachi Gupta in an exclusive interview. Edited excerpts:
The PLFS data shows that the unemployment rate is at a 5-year low. Does this figure actually capture the unemployment scenario in the country?
The government’s definition of unemployment for the PLFS survey has not been in compliance with the international definition of what is defined as unemployment for about 10 years. These same estimates had shown in 2017-18 a 45-year high in unemployment and tripling of youth unemployment for the ages 15-29 between 2012 and 2017, which is why the entire country was abuzz with the news that India had reached a 45-year high in unemployment rate.
READ | Urban unemployment data mask gender gap, quality of work
The twin shocks of demonetisation in 2016 and GST rollout hit India’s non-farm enterprises hard. They lost workers and some enterprises started closing down. The MSMEs were the worst sufferers of these ill-advised policy rollouts.
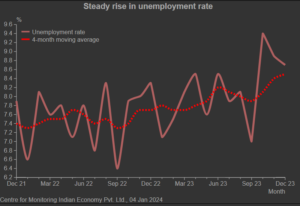
After 2017, the economy went downhill all the way till 2020 when COVID came. The economy slowed dramatically in the first five years of the BJP government, causing historic unemployment. That the government was not denying. So when did the numbers begin to improve? The government said look how beautiful the numbers are now. Problem, however, is after COVID, there was a third shock -this time on the health system. Out of pocket expenditures were on rise and the second was the nature of the economic policy management during 2021 and 2022. So, the result was unemployment has been on an increase.
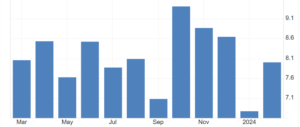
India unemployment rate (%)
The most important point is over the three-year period, 60 million workers were added to agriculture. The first year of COVID in 2020 alone, 35 million workers reverse migrated to agriculture. These were concentrated in seven or eight sending states of the country. There are destination states and there are sending states for migrant workers. They returned and they added, but as a result of reverse migration which took place in the first wave in 2020, the second wave in 2021 and the third wave in 2022. The government’s own data is showing that in 2022-2023 which is the latest PLFS data, the share of workers in agriculture which was in 2018-19 stood at 42% of the total workforce, that share went to 46.5%. In 2022-23, it fell slightly to 45%. All this is coming from PLFS data.
The point is the increase in agriculture completely reversed the decline in the number of workers in agriculture that had been happening from 2004 onwards till 2018. In other words, it completely reversed a good development that was happening for the preceding 15 years. This is the opposite of what should happen in a developing country. People should not be going back to agriculture, rather they should be leaving agriculture that is what development is all about. That the share of agriculture in output and employment drops and industry and services rise.
The result of this is that the women who were coming out of agriculture went back to agriculture and migrants also went back to agriculture.
There are three types of employment globally- two types of wage labour and self-employment. One wage labour is regularly salaried and the other is casual worker which is known as ‘dihadi mazdoor’. The other category is usually presumed as businessmen but also encompasses mochi or sabziwala. This is a class perspective that self-employed means business men but the category only accounts for 2% of the 58% of the weightage that self-employed hold in overall employed numbers. The remainder is own account workers such as barbers, vendors, cobblers.
There is other large category which is unpaid family labour. By ILO metric, this is not regarded as labour but the government does regard it as employment. This has seen an increase of 55 million between 2018-19 and 2022 (rural and urban included). Schools were closed for two years; children were working on fields and this was considered employment. Family incomes collapsed because there was no remittance. 60 million people went back to eight or ten states of the country and found something to do.
As a result, regular wage work collapsed, and what rose was own account workers or unpaid family labour. Both were considered an increase in labour force participation and work and a reduction in unemployment. This is what Surjit Bhalla calls “Job full growth”. This is what he called it in March of 2023 in Times of India.
It is simple to understand but when you keep portraying things differently and the media run by Adani Ambani keeps repeating the same thing, you manage to keep people hoodwinked.
It is a complete contrast between what CMIE says which is a reason why the government keeps debunking CMIE data and what the government’s own data says. CMIE uses an internationally compliant definition.
Why can’t we use CMIE data as the official figure? Why do we have other metrics such as PLFS?
I disagree with you here. The government must generate labour force surveys as it has done for the last 50 years in the country. But its definition must be upgraded and be internationally compliant. For three years the government had appointed me on the standing committee for the statistics which is advising the government. We had suggested doing a pilot survey using the ILO questionnaire. And then apply the same definition and similar questionnaire to the PLFS, but they will not do it.
What are the hidden challenges such as low wages, lack of benefits, job security etc that the data is not able to capture?
The data is capturing all that. If you want wages data, you can see from the data itself that the wages have flattened out, there is no increase in the wages. The wages increased only until the growth rate was 8% per annum.
The youth unemployment has tripled by the government’s own metrics. Forget about job security. This is why CMIE keeps saying that for 20–25-year-olds, unemployment for youth is 44%. The government says it is nearly 20%.
As far as social security is concerned, the data tells if the contract is for one year or two years, or more than three years, it tells you what the wages are, it tells you whether the job involves three or five types of benefits such as maternity, pension, etc.
There is no evidence that informality in the workforce is dropping. It actually accounts to 91% of the total workforce.
That is quite high. How does it compare with the developed countries?
Of course not. Across the world, the share of the workforce that is informal, it is around 60%.
This is from the workers point of view. Then there is the issue that enterprises are also informal as they are not registered. The reasons why are workers are informal and not registered is because the government does not know about the existence of the vast majority of those who work in informal enterprises which are unregistered. Enterprises in the non-farm sectors in the country (it is 66 million) and they are in manufacturing, construction and if you have more than 10 workers then you are supposed to register them. But that is not the case. That says about the work that labour inspectors are doing in the country. But, in a country with 66 million non-farm enterprises, there are 6,000 labour inspector posts only of which 3,000 posts are vacant.
More importantly, the pink press focusses only on the registered enterprises and their focus is on the 3% which can be regarded as large companies. 97% of the units are what can be called MSMEs and it also accounts the own- account workers.
Of the unorganised sector, i.e. the units which have less than 10 workers, 70% of them are not registered anywhere. The remaining that are registered, they are registered under so many different Acts according to different states that the government does not know and it does not care.
It is only recently that the UDYAM portal came up and the GST came up as a result of which the larger of MSMEs have registered themselves. Vast majority of the units still remain informal. So inevitably, a majority of those who work there are without social security.
What can we do to increase female participation in the labour workforce?
All girls must complete ten years of schooling and then they must try and acquire some skills. But the only way that they are going to actually find work in the non-farm sector rather than going back to farming is that the jobs grow. That is not happening any soon.

Prachi Gupta is an Assistant Editor with Policy Circle. She is a post graduate in English Literature from Lady Shri Ram College For Women, Delhi University. Prachi started her career as a correspondent with financialexpress.com. She specialises in policy impact studies.