





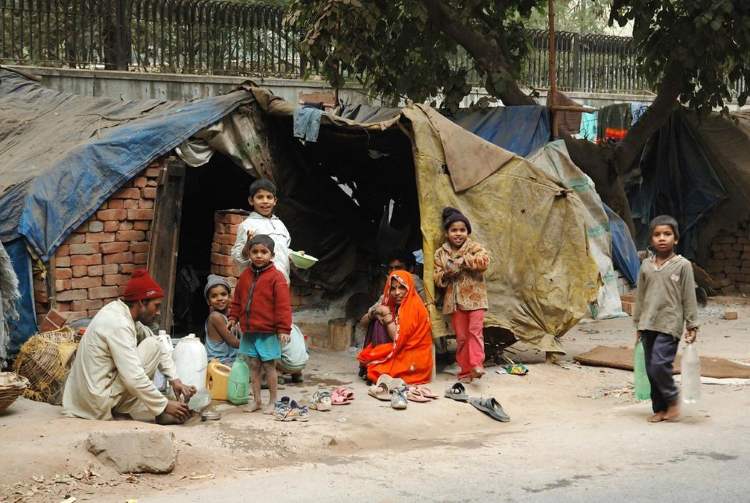
The World Bank’s latest assessment of poverty in India presents a remarkable picture. Extreme poverty fell from 27.1% in 2011-12 to 2.6% in 2023-24. At the higher poverty threshold applicable to lower-middle-income countries, the proportion of poor declined from 57.7% to 16.1%. The Bank estimates that 496 million Indians, nearly 50 crore people, escaped poverty during these 12 years. Its October 2026 Poverty and Equity Brief describes this as one of the fastest declines in poverty anywhere in the world. The numbers are impressive, but their reliability is open to question. The Bank has compared household consumption surveys conducted using substantially different methodologies, with adjustments whose limitations it acknowledges in its own technical documentation.
India has certainly made progress in reducing deprivation. The expansion of public food distribution, improvements in housing and sanitation, and wider access to electricity and banking have improved living conditions. There is less certainty about how much household purchasing power has increased. The poverty estimates also sit uncomfortably with the evidence of stagnant real wages and the return of millions of workers to agriculture.
The World Bank’s findings have obvious political appeal. They also influence economic policy and the assessment of India’s development record. The quality of the evidence behind them warrants closer scrutiny.
READ I India’s poverty gains are real, but economic security remains elusive
Household surveys make poverty estimates uncertain
The principal difficulty lies in comparing household consumption expenditure surveys conducted in 2011-12 and 2023-24. The earlier survey generally collected expenditure information during a single visit. The newer surveys spread the exercise over three visits, with separate questionnaires for food, other consumables and services, and durable goods. The sampling design also changed.
More detailed questioning can capture expenditure that households fail to recall during a single interview. A change in sampling can alter the composition of households covered. Either can raise measured consumption without a corresponding improvement in actual living standards.
The World Bank has attempted to correct for these differences. Its 2025 methodology note reconstructs the earlier estimates using the modified mixed reference period available in the 2011-12 survey, alongside adjustments to the consumption aggregates.
The exercise is technically elaborate, and the Bank has published the underlying methodology and computer code. Its documentation nevertheless identifies shortcomings that the headline poverty figures do not adequately convey.
Changes in sampling design could lead to an upward bias in consumption estimates and an understatement of inequality. Additional expenditure categories in the newer survey accounted for an average 3.7% of nominal spending in 2022-23. More importantly, the absence of a bridge survey, which would measure consumption under both methodologies, prevents a conclusive assessment of the effects of these changes.
The Bank has therefore estimated a long-term trend without being able to establish conclusively the size of the methodological distortion. The claim that 496 million Indians escaped poverty gives a misleading impression of statistical precision.
A range of plausible estimates, showing how the result changes under different assumptions, would give policymakers a sounder basis for judging the extent of poverty reduction.
READ I Common household database key to bridging poverty gap
No updated national poverty line
India’s last officially adopted poverty estimates relate to 2011-12 and follow the Tendulkar Committee methodology. The Rangarajan Committee subsequently recommended a higher poverty threshold, but the government did not adopt it. India consequently relies increasingly on the World Bank’s international poverty lines to assess its progress.
The Bank’s extreme poverty threshold of $3 per person per day, expressed in 2021 purchasing power parity, is equivalent to approximately ₹58 in 2021 prices. The $4.20 threshold for lower-middle-income countries is roughly ₹82. These figures are calculated using purchasing power parity rather than market exchange rates.
Such thresholds are useful for international comparisons. Their relevance to the cost of maintaining a reasonable standard of living in India is less clear. A household spending marginally more than ₹82 per person per day may still be unable to meet essential expenses without government assistance.
The treatment of subsidised consumption introduces another complication. The Bank includes imputed values for certain free or subsidised goods in its welfare calculations. This is appropriate when assessing the consumption benefits of public transfers, but it complicates the interpretation of poverty reduction as evidence of rising private purchasing power.
The government continues to provide free foodgrains to around 80 crore people. That does not contradict a decline in extreme poverty, since the programme covers households well above the Bank’s lowest poverty threshold. It does, however, indicate how many Indians remain dependent on public assistance for an essential part of their consumption.
The Bank’s figures tell us how many people have crossed a particular expenditure threshold. They reveal much less about the security of their livelihoods or their ability to withstand a sudden loss of income.
Weak wages and farm jobs complicate the picture
India’s employment record presents a more serious challenge to the poverty estimates. The World Bank itself acknowledges that real earnings have remained broadly unchanged and that much of the increase in employment has occurred in relatively low-productivity activities.
Agricultural employment has risen substantially in recent years, reversing the earlier movement of labour into non-farm occupations. Estimates vary with the definition and period used, but the increase runs into tens of millions of workers.
This reversal is difficult to square with the conventional process of economic development. Higher incomes ordinarily accompany a shift of labour from low-productivity farming into manufacturing and services. India’s experience has increasingly been the opposite.
The increase in female labour force participation requires similar care in interpretation. Much of it has occurred through self-employment and unpaid work in family enterprises, particularly agriculture. Official statistics correctly classify these women as employed. Their participation, however, may add little to household earnings where the work is unpaid or undertaken because better opportunities are unavailable.
Aggregate employment numbers therefore provide an incomplete picture of economic progress. The distinction between paid employment and unpaid family work becomes especially important when changes in labour force participation are used to explain rapid poverty reduction.
Some casual workers have experienced gains in real earnings, and government transfers have undoubtedly supported consumption among poorer households. These improvements could account for part of the reduction in poverty. The available evidence does not establish that enough productive employment has been created to explain the extraordinary decline reported by the Bank.
The informal economy also suffered successive disruptions following demonetisation, the introduction of the goods and services tax and the Covid-19 pandemic. The extent and persistence of the damage are disputed, but the weakness of non-farm employment is evident in the return of workers to agriculture.
An assessment that celebrates rising employment while acknowledging stagnant earnings leaves an important part of the poverty story unexplained.
Consumption inequality hides disparities
The World Bank’s findings on inequality are equally open to misinterpretation. Its consumption-based Gini index suggests a decline in inequality between 2011 and 2023. Yet the same assessment reports that median earnings among the highest-paid 10% of workers were about 13 times those of the lowest-paid 10%.
Estimates of wealth distribution show even greater concentration, with the richest 1% holding around 40% of national wealth.
Consumption, income and wealth inequality measure different aspects of household welfare. Consumption is generally distributed more evenly than income because households use savings, borrowing and transfers to maintain expenditure. Wealth is more concentrated still.
India’s household consumption surveys also provide a poor account of expenditure among the richest households. The World Bank recognises that the missing upper end of the distribution can lead to an understatement of inequality. Changes in sampling design create additional uncertainties.
A fall in consumption inequality therefore tells us little about the distribution of income and wealth. The absence of a comprehensive household income survey makes it difficult to establish how the gains from economic growth have been shared.
The Bank should be particularly cautious about presenting an improvement in the consumption Gini as evidence of a more equitable economy when substantial gaps remain in the measurement of household incomes and assets.
India needs credible poverty statistics
The controversy over the World Bank’s estimates reflects a longstanding weakness in India’s statistical system. The government withheld the 2017-18 household consumption survey, citing concerns about data quality. The next survey, conducted in 2022-23, used a substantially different methodology. This left a gap of more than a decade in a statistical series that is central to economic policymaking.
The World Bank has tried to reconstruct the missing continuity. Its technical work is useful, but no statistical adjustment can fully compensate for the absence of comparable observations.
The government should establish a new national poverty line and undertake regular household consumption surveys using consistent methods. Changes in survey design should be accompanied by bridge studies that allow researchers to distinguish improvements in living standards from changes in measurement. Reliable data on household income and employment quality would make poverty estimates more informative.
The World Bank has good reason to acknowledge India’s progress. Its own figures suggest that about 23 crore Indians remain below the $4.20 poverty threshold, despite the reported decline. That population is larger than that of most countries and deserves greater attention than declarations about the near-elimination of extreme poverty.
The Bank’s principal claim, that nearly 50 crore Indians escaped poverty, rests on a comparison whose limitations it has documented but cannot fully resolve. For an institution whose assessments carry considerable authority, the appropriate response is greater transparency about the uncertainty, rather than confidence extending beyond what the evidence can establish.