





India’s social sector spending: India’s social-sector finances are undergoing a consequential shift. State governments are carrying a growing share of the burden of financing health, education, welfare, and other public services. The Reserve Bank of India puts states’ social-sector expenditure at 8.2% of GDP in the 2025-26 Budget Estimates, accounting for nearly 47% of their aggregate expenditure. Yet the headline increase conceals a less comfortable trend. Education has steadily lost budget share, while the gains in health spending since the pandemic remain modest.
The change matters because most services that determine the quality of everyday life are delivered by states. Schools, hospitals, public health systems and large parts of the welfare machinery depend on state finances. If the fiscal balance between the Union and the states changes, the consequences eventually show up in classrooms, primary health centres and household welfare.
READ | Tamil Nadu welfare programmes need a stronger revenue base
Centre’s direct spending share has fallen
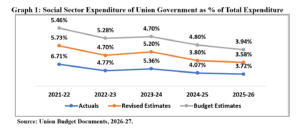
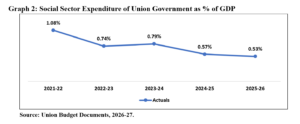
Union spending classified under the social-sector heads covered by these budget calculations has declined sharply since the pandemic. As a share of total expenditure, it fell from 6.71% in 2021-22 to an estimated 3.72% in 2025-26. Relative to GDP, the decline was from 1.08% to 0.53%.
Graph 1: Social Sector Expenditure of Union Government as % of Total Expenditure
Source: Union Budget documents, various years.
These figures need to be read with some care. They capture direct Union expenditure under the relevant budget heads, rather than the full flow of central resources into social programmes. Centrally Sponsored Schemes are jointly financed by the Centre and states, with much of the expenditure eventually appearing in state budgets. A decline in direct Union expenditure therefore does not translate mechanically into an equivalent withdrawal of central support.
Graph 2: Social Sector Expenditure of Union Government as % of GDP
Source: Union Budget documents, various years.
What the numbers do show is a change in where social expenditure is increasingly recorded and delivered. The states were always central to the provision of health, education and welfare. Their fiscal role has become more pronounced.
States allocating more to social services
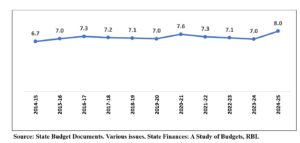
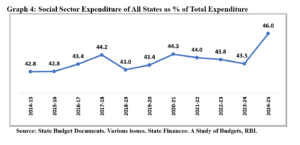
The longer state series moves in the opposite direction. Social-sector expenditure by states rose from about 6.7% of GDP in 2014-15 to around 8% by 2024-25. Its share of aggregate state expenditure increased from 42.8% to roughly 46%.
The RBI’s latest numbers extend that trend. States budgeted social-sector expenditure at 8.2% of GDP in 2025-26, or close to 47% of their total expenditure. The category is broad, covering social services as well as rural development, food storage and warehousing.
Graph 3: Social Sector Expenditure of All States as % of GDP
Source: State budget documents; RBI, State Finances: A Study of Budgets, various issues.
The pandemic disrupted the trajectory for a few years as revenues weakened and governments faced exceptional fiscal pressures. But the decade-long direction is clear: state budgets are devoting a larger part of national income and public expenditure to the social sector.
Graph 4: Social Sector Expenditure of All States as % of Total Expenditure
Source: State budget documents; RBI, State Finances: A Study of Budgets, various issues.
That aggregate, however, can mislead. A larger social-sector envelope does not mean every component is receiving greater priority. Education and health tell very different stories.
READ | Gujarat model needs a welfare correction
Social sector spending: Education steadily losing share
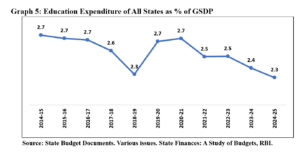
Education is the more troubling case. State spending on education fell from about 2.7% of GSDP in 2014-15 to 2.3% in 2024-25.
Graph 5: Education Expenditure of All States as % of GSDP
Source: State budget documents; RBI, State Finances: A Study of Budgets, various issues.
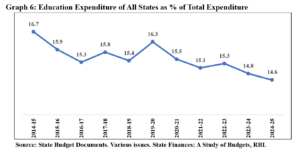
The decline is equally visible within state budgets. Education accounted for 16.7% of total state expenditure in 2014-15. By 2024-25, the share had slipped to 14.6%. Budget allocations for 2025-26 suggest little reversal.
Graph 6: Education Expenditure of All States as % of Total Expenditure
Source: State budget documents; RBI, State Finances: A Study of Budgets, various issues.
The distinction between nominal spending and budget priority is important. Governments may spend more rupees on education every year while allowing it to absorb a progressively smaller part of the budget. If that persists, expenditure will struggle to keep pace with demands for better schools, more teachers, stronger universities and improved learning outcomes.
India’s ambitions in manufacturing, technology and services ultimately depend on the quality of its human capital. A sustained erosion in education’s claim on state budgets sits uneasily with those ambitions.
READ | Kerala elderly welfare needs a state-built care system
Health has gained, but not by enough
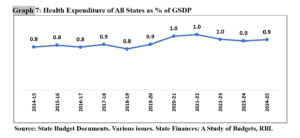
Health expenditure has fared better. State spending rose from roughly 0.8% of GSDP in 2014-15 to around 0.9% by 2024-25. The pandemic produced a more pronounced increase as governments were forced to spend on hospitals, equipment, public-health systems and medical personnel.
Graph 7: Health Expenditure of All States as % of GSDP
Source: State budget documents; RBI, State Finances: A Study of Budgets, various issues.
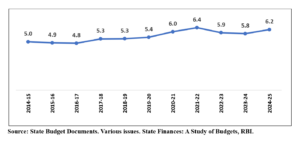
As a share of total state expenditure, health rose from about 5% in 2014-15 to 6.2% in 2024-25. The improvement is welcome, but the post-pandemic numbers give little evidence of a decisive structural break. States have budgeted about 6.2% of expenditure for health and family welfare in 2025-26. Only a handful meet the National Health Policy benchmark of allocating 8% of their budgets to health.
Graph 8: Health Expenditure of All States as % of Total Expenditure
Source: State budget documents; RBI, State Finances: A Study of Budgets, various issues.
Covid exposed how costly weak public-health capacity can be. Once the emergency passed, however, some of the additional fiscal priority given to health also began to recede. The risk is that the pandemic is treated as an exceptional episode rather than a warning about chronic underinvestment. The larger constraint lies in state finances themselves. Salaries, pensions, interest payments and subsidies absorb a substantial part of state revenues before governments begin allocating money to development. Borrowing costs and debt servicing narrow the room further. States with the greatest need for stronger public services are often those with the least fiscal space to expand them.
This is where India’s fiscal federalism meets its development challenge. States are being asked to sustain an ever larger share of the spending that shapes health, education and welfare outcomes. The rise in overall social-sector expenditure is therefore only half the story. What matters is whether states have enough fiscal room to protect the programmes that build human capital when revenues weaken and competing claims on their budgets rise.
Education’s shrinking share should be the warning signal. A country seeking faster growth cannot indefinitely allow one of its most important long-term investments to lose ground inside government budgets.
Dr Shelly Dahiya is a Consultant with NITI Aayog. The views expressed in this article are personal and do not necessarily reflect the views or official position of the affiliated institution.