

Manufacturing slowdown: India’s gross domestic product expanded at a robust rate of 7.8% in the April-June quarter, up from the 6.1% in the January-March quarter. The growth was broad-based, but was primarily driven by the remarkable expansion of 10.3% in the services sector. Within the industrial segment, the construction sector exhibited impressive growth at 7.9% during the first quarter of fiscal year, while the manufacturing sector posted a subdued growth rate of 2.7%.
Official estimates suggest weak growth for the manufacturing sector, but it is crucial to analyse specific sub-sectors within manufacturing to understand the drivers of this tepid performance. However, official estimates typically provide growth figures at the sector level, offering limited granularity. This article aims to address this gap by delving deeper into the performance of individual sub-sectors within manufacturing, providing a more detailed perspective.
To achieve this objective, our study relies on a common sample of 1300 manufacturing firms, covering the period from June 2018 to June 2023. Data is sourced from the Centre for Monitoring Indian Economy’s (CMIE) Prowess database. The study assesses performance at two levels: first, at a broader level, and then within the manufacturing sector, it examines 10 sub-sectors.
The primary metric for assessing growth performance is gross value added (GVA). Using the firm-level database, GVA is computed using the Income side approach, which involves summing up profit before tax (PBT), salaries and wages, and depreciation at current prices. This approach aligns with the methodology followed by the ministry of statistics and programme implementation (MOSPI) to calculate GVA estimates using quarterly financial data from publicly listed firms.
READ I Cash crunch: India’s green hydrogen mission faces resource shortage
Comparison of growth in manufacturing industry
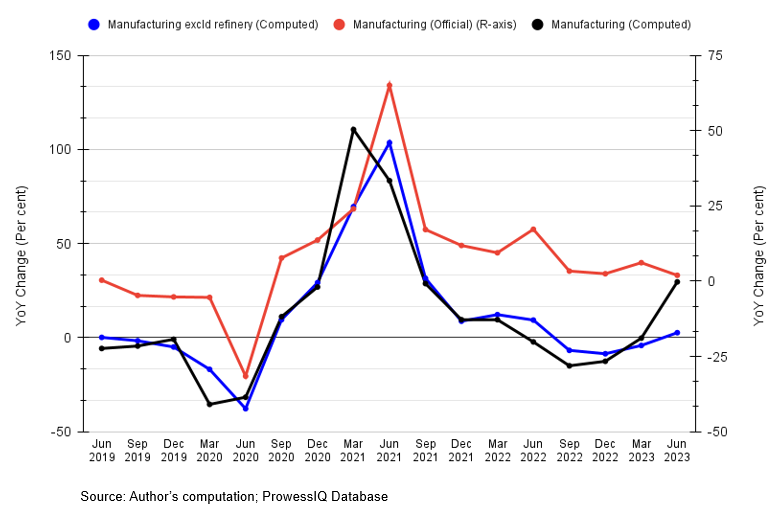
Before we delve into the performance of sub-sectors, we present a comparison of growth rates computed using the CMIE Prowess database and the official estimates. The figure below illustrates the comparison of the manufacturing sector’s growth rate as computed using the sample of 1300 firms, both with and without the inclusion of firms in the refinery sector. Refinery firms, primarily state-owned entities with substantial balance-sheet size, have the potential to distort the overall sector growth, potentially overshadowing growth in other sectors.
The blue line in the figure represents computed growth excluding the refinery sector firms, while the black line includes these firms. The black line shows a recent surge in growth, while excluding the refinery firms results in comparatively lower growth. This suggests the refinery sector firms may disproportionately impact the overall manufacturing sector growth.
The figure demonstrates that the trajectory of official estimates of manufacturing sector growth closely aligns with computed manufacturing sector growth. This alignment is further supported by a high correlation of 0.93 between the two growth rate series. This analysis is presented in terms of current prices.
Drivers of manufacturing slowdown
The strong correlation between official and computed growth rates indicates that insights from the firm-level database can be used to analyse the manufacturing slowdown. The table below displays the growth rate of the manufacturing sector and its sub-components using the firm-level database. Similar to MOSPI’s approach, these figures represent GVA growth. Key observations are outlined below:
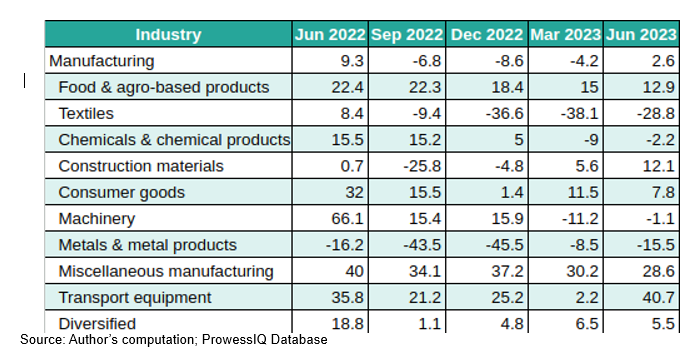
At the broader category level, the manufacturing sector exhibited subdued performance, with a growth rate of 2.6% (at current prices) in the first quarter of fiscal year 2023-24. This contrasts sharply with the robust 9.3% growth recorded during the same period in the previous year. According to MOSPI’s estimates, the manufacturing sector posted a growth rate of 1.94% at current prices.
The headline growth figure, however, masks considerable sectoral variations in growth. Sectors such as food and agro-based products, construction materials, transport equipment, and miscellaneous manufacturing recorded remarkable GVA growth rates of 12.9%, 12.1%, 40.7%, and 28.6%, respectively, during the first quarter of fiscal year 2023-24.
Conversely, certain sectors experienced muted growth, notably textiles, chemicals and chemical products, machinery, and metals and metal products. These sectors make significant contributions to manufacturing gross value added, with metals and metal products and chemicals and chemical products being particularly significant. The contraction in growth rate in these key sectors exerted downward pressure on the overall manufacturing sector’s growth.
One of the primary factors contributing to this lackluster performance in the June quarter was the decline in prices across commodities, including metals and oil, coupled with weakened global demand. The World Bank’s Pinksheet Base Metals Index, a useful gauge of commodity prices, has been on a declining trend since the beginning of 2023.
In January, the price index stood at 121, gradually decreasing to 106.7 by June and further dropping to 105.2 by August 2023. Similarly, Brent crude oil prices witnessed a decline, falling from $82.5 per barrel in January 2023 to $74.8 per barrel by the conclusion of June 2023, marking a nearly 9% decrease over that period. Sectors particularly sensitive to the global commodity price outlook exhibited a visible decline in growth rate in the June quarter. Factors such as subdued global demand, China’s muted economic growth, and ongoing geopolitical tensions have compounded the challenges for the manufacturing sector.
(Radhika Pandey is associate professor and Pramod Sinha is a Fellow at National Institute of Public Finance and Policy (NIPFP). Views are personal.)