Multidimensional poverty index: The central purpose of development policy is to enhance human well-being, not merely to raise incomes. Income remains a useful proxy, but it fails to capture critical dimensions of welfare such as health, education, and living conditions. This limitation was addressed by the human development framework articulated by Amartya Sen and operationalised by Mahbub ul Haq through the United Nations Development Programme. Since the first Human Development Report in 1990, development has increasingly been understood as the expansion of people’s capabilities rather than the accumulation of output alone.
Poverty, within this framework, reflects deprivation across essential dimensions of life. This shift matters for policy because it allows governments to judge whether public spending is improving lived outcomes rather than merely boosting aggregate growth.
READ I Eradication of extreme poverty in Kerala sets a new benchmark
Why Multidimensional Poverty Index
The Multidimensional Poverty Index (MPI), developed by the UNDP and the Oxford Poverty and Human Development Initiative, measures acute poverty across three dimensions—health, education, and standard of living—using twelve indicators derived largely from household surveys. These indicators align closely with multiple Sustainable Development Goals, including SDG 1 (No Poverty), SDG 3 (Health), SDG 4 (Education), SDG 6 (Water and sanitation), and SDG 7 (Energy).
India formally adopted this framework through NITI Aayog’s first national MPI report in 2021, followed by an updated edition in 2023 using a consistent methodology. This continuity strengthens inter-temporal and inter-state comparisons, making MPI a credible policy instrument.
READ I Why India’s poverty decline may not be what it seems
The scale of poverty reduction
Between 2015–16 and 2019–21, India recorded a substantial decline in multidimensional poverty. The share of the population classified as MPI-poor fell from 24.85% to 14.96, a reduction of 9.89 percentage points. Rural areas drove much of this improvement, with poverty falling from 32.59% to 19.28. Urban poverty declined more modestly, from 8.65% to 5.27.
This rural-led reduction is significant because deprivation in India has historically been deeper and more persistent outside cities, reflecting long-standing gaps in sanitation, nutrition, housing, and energy access.
READ I From poverty to precarity: India’s uneven growth story
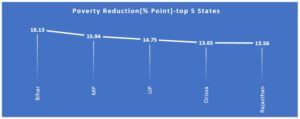
Gains concentrated in poor states
The steepest declines occurred in states long associated with weak social indicators. Bihar reduced its MPI headcount from 51.89% to 33.76 between 2015–16 and 2019–21. Madhya Pradesh saw a fall from 36.57% to 20.63, while Uttar Pradesh, Odisha, and Rajasthan each recorded reductions exceeding 13 percentage points.
In rural areas, Madhya Pradesh recorded the largest decline, followed by Bihar and Uttar Pradesh. In urban areas, Bihar, Odisha, and Rajasthan showed the sharpest reductions. These outcomes indicate that improvements were not confined to already better-off regions.
Absolute numbers tell a larger story
In absolute terms, the scale of improvement is striking. Uttar Pradesh alone accounted for 3.43 crore people exiting multidimensional poverty over this period, followed by Bihar (2.25 crore), Madhya Pradesh (1.36 crore), Rajasthan (1.08 crore), and West Bengal (0.93 crore). Across India, an estimated 13.5 crore people moved out of MPI poverty between 2015–16 and 2019–21.
Nearly two-thirds of this reduction came from just five states, underlining both the demographic weight of these regions and the importance of sustaining progress where deprivation remains concentrated.
Falling intensity, faster SDG progress
Beyond headcount ratios, the Multidimensional poverty index value nearly halved—from 0.117 to 0.066—signalling a decline in both the incidence and depth of deprivation. The intensity of poverty fell from 47% to 44, indicating that even among the poor, multiple deprivations eased.
These trends place India on course to meet SDG Target 1.2—halving multidimensional poverty—well ahead of the 2030 deadline, reflecting cumulative gains from basic service delivery rather than short-term income growth.
Welfare delivery, not income growth alone
The pattern of improvement closely mirrors the expansion of essential public services. Sanitation deprivations declined following the Swachh Bharat Mission, while access to drinking water improved through the Jal Jeevan Mission. Clean cooking fuel availability rose under the Pradhan Mantri Ujjwala Yojana, reducing indoor air pollution.
Health-related deprivations fell alongside Poshan Abhiyan and Anaemia Mukt Bharat. Financial inclusion expanded via the Pradhan Mantri Jan Dhan Yojana, while electricity access improved under Saubhagya.
However, the Multidimensional poverty index captures access to services, not economic security. During the same period, real wages in the informal sector stagnated and urban employment recovery remained uneven, particularly after the pandemic shock. Household indebtedness also rose, especially among poorer households.
This divergence suggests that while deprivation has eased, vulnerability remains. MPI gains should therefore be read as improvements in basic living conditions rather than a full resolution of income poverty.
State capacity explains uneven outcomes
Differences across states also reflect variations in administrative capacity. The same centrally designed schemes produced faster and more durable outcomes where state institutions were stronger. Kerala’s low MPI reflects decades of investment in public health, education, and local governance, while rapid improvements in Bihar and Uttar Pradesh point to improved last-mile delivery rather than structural convergence.
Multidimensional poverty index outcomes thus highlight the role of state capacity and local implementation, not just central programme design.
Fiscal sustainability and reforms
The durability of these gains depends on fiscal sustainability. Welfare-led reductions in deprivation rely heavily on subsidies and transfers, at a time when state finances face pressure from rising debt and limited revenue buoyancy. Long-term poverty reduction will require a gradual shift from entitlement expansion towards productivity-enhancing social spending.
This has implications for fiscal federalism. With the Planning Commission abolished, general-purpose transfers are now the primary equalisation tool. The Sixteenth Finance Commission has an opportunity to incorporate MPI into its horizontal devolution formula. There is precedent: the Twelfth Finance Commission used a deprivation index for local grants. MPI now offers a more robust, outcome-based measure.
India’s MPI gains show that large-scale poverty reduction is achievable when service delivery reaches households effectively. The next reform challenge is institutional. Embedding multidimensional poverty metrics into fiscal devolution would align public resources with actual deprivation. Growth raises incomes, but durable development requires fiscal policy to follow need. MPI provides the evidence base to do exactly that.
Dr Barna Ganguli is Faculty at Bihar Institute of Public Finance and Policy (BIPFP), a research unit of Finance Department, Government of Bihar. Manoj Narayan is a social policy expert.